Solar Energy
1. Overview
Energy is presently harvested from the sun directly through the use of two principle technologies — photovoltaics (PV) and Concentrated Solar Power (CSP). CSP involves directing the heat from sunlight, often via large curved dishes, onto a solar cell or panel. The heat is then converted to electricity. Solar PV utilizes semiconductor material to convert sunlight directly into electricity. This is accomplished via the photovoltaic effect where photon strikes enable the movement of electrons from one layer of silicon to another thus generating current. The principle semiconductor technologies are crystalline silicon and thin film cells composed of cadmium telluride (CdTe). This latter technology accounts for roughly 5% of solar cell production.
PV is the dominant technology representing roughly 95% of solar generation capacity in 2019. First invented in 1954 at the Bell Telephone Laboratories, PV modules are presently deployable at (i) utility, (ii) distributed and (iii) community-scale solar — community being a hybrid of the prior two. Utility solar is typically greater than 20MW of generation capacity. Distributed generation is typically up to 20MW for commercial entities and up to 10kW for residences.
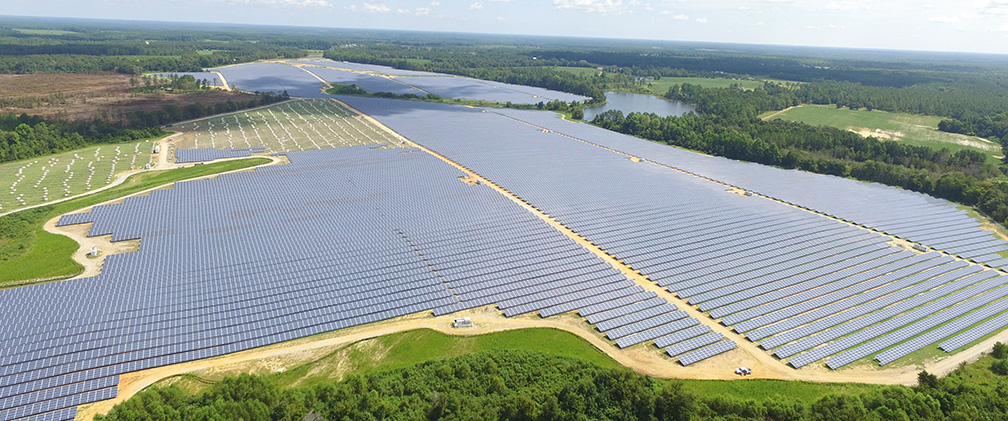
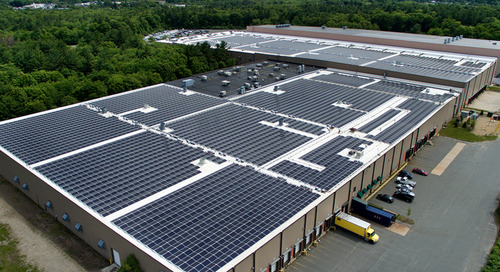
Utility-scale projects are large scale solar farms where the end buyer is typically a utility. The power is sold per the terms of a power purchase agreement or PPA. Around 60% of total installed capacity in the US is utility-scale. Distributed-scale solar projects are installed on residences and commercial developments where the produced energy is consumed on site with excess generation being sold to the grid.
2. Market Trends
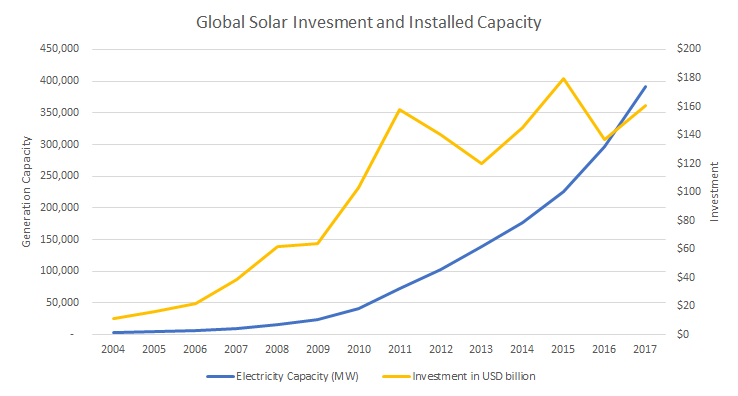
The potential for growth in solar is enormous as some estimates suggest that the solar radiation landing on 0.6% of the Earth’s surface could supply the total electricity needs of the planet. However, the interplay of cost, efficiency, investment, substitution, regulation and incentives will dictate the rate at which the share of solar generation in the overall energy mix will grow. In the last decade we have seen an exponential rate of growth in MW of installed capacity. This has been driven by investment growth which has gone from around $10 bn in 2004 to around $150 bn in 2011. Investments have remained at healthy levels averaging $150 bn since the initial ramp up. While impressive, the total contribution of solar to utility-scale generation is less than 2% — and it remains in 3rd place behind hydro and wind in the US renewable energy mix.
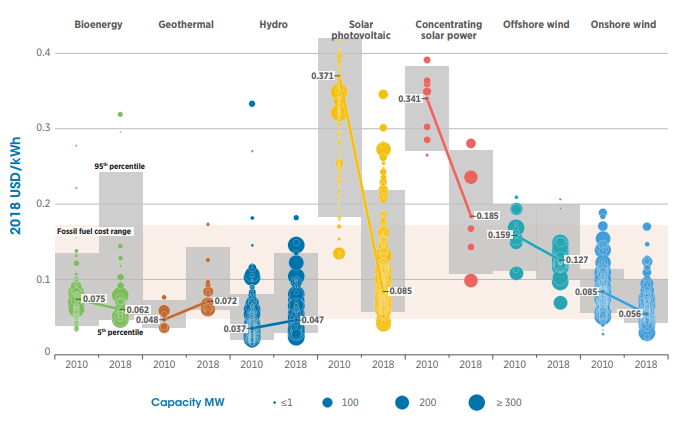
The increased usage of solar power generation is derived primarily from the increasingly scalable and efficient use of solar PV modules. The cost of these modules have contracted by over 80% since 2010 improving their competitiveness at commercial scales while also growing in accessibility at the residential production level.
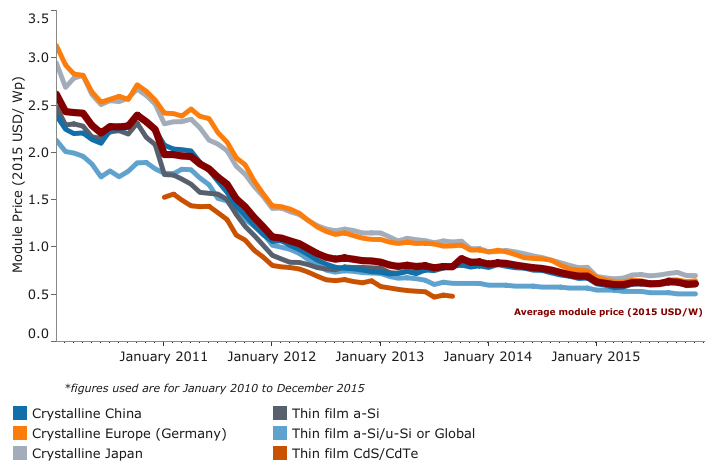
The trends in solar cost in comparison to other sources bodes suggest that parity with fossil fuel sources may be realized within several years.
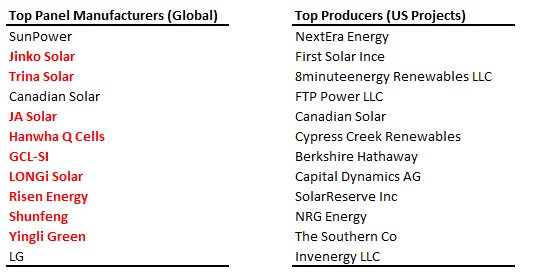
The top manufacturers in the solar space as well as top producers by US generating capacity are outlined below. Many producers are based in China (red text) which adds to market uncertainty given the recent trade disputes. The top 10 project owners account for ~40% of total installed or under-construction project capacity.
3. Solar Finance
Solar utility power purchase agreement (PPA) terms govern the generation and purchase price of power over time horizons spanning 15-25 years. The long-term nature of the cash-flows associated with a PPA provides a fixed source of income over the duration of the project.
Project finance is the primary means of capitalizing solar projects.
4. The Solar Value Proposition
While in no way minor, the benefits of solar expansion in terms of the mitigation of climate change effects are obvious, but solar also represents an opportunity for investor exposure to the energy transition.
Solar project finance is a sector within the Infrastructure & Power Finance (IPF) market. Similar to securitized products, IPF is a form of asset backed lending where the securitized asset is the cash-flow streams generated from the project. The infrastructure finance market is a key component in the continuing growth of PV deployment.
Generally market participants will be exposed to four types of risk during the transition (i) demand and technology risks (ii) market price risks (iii) policy risks and (iv) other risks.Although energy transition risks are often attributed to the impacts of realigning the economic system with low carbon solutions through market, technology, regulation, and policies, in practice, it is difficult to quantify some of these risks. For example, cash flow impacts from non-linear risks, such as new regulations or a technological disruption are hard to model due to uncertainty around their timing and magnitude. However, all information about the level of risk a particular company is exposed to can usually be summarised in a single parameter, namely, the discount rate. Investors adjust their beliefs about the risk level by adjusting the level of the discount rate.
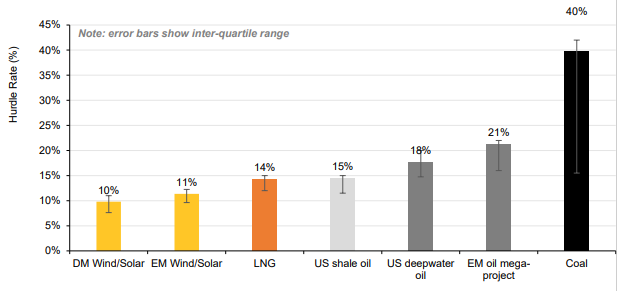
An Oxford survey of investors shows that concerns over energy transition have already started to alter the risk preferences of investors in fossil fuel projects. Investors are demanding a higher hurdle rate in order to invest in long cycle oil and coal projects.
5. Macro Projections
Having discussed technological, regulatory and investment trends, the problem facing the energy system modeler is to extrapolate the future state of the solar space.
The EIA’s long term projections estimate that most of the electricity generating capacity additions installed in the United States through 2050 will come from natural gas combined-cycle and solar PV. The EIA uses a ‘build decision’ model in working out this projection. Taking the ratio of the levelized avoided cost of electricity (LACE) to the levelized cost of electricity (LCOE) one obtains a value-to-cost (or revenue to cost) ratio. When the ratio exceeds one – the projected LACE exceeds the projected LCOE — the project is economic.
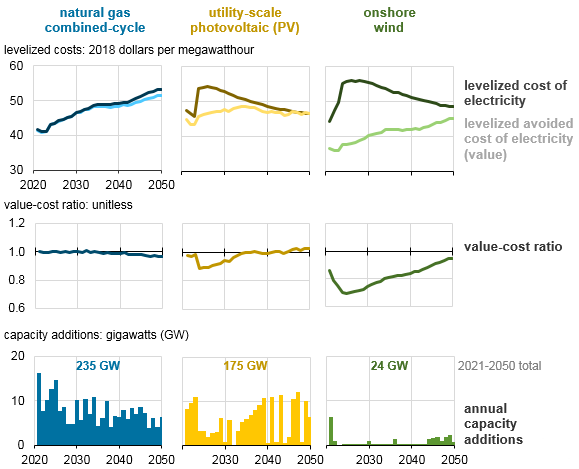
The solar PV LACE increases due to the loss of the US tax credits but then declines reflecting the cost reductions characterizing the PV technology. On the basis of this build decision path the 2019 AEO projects 175 GW on PV installation capacity out to 2050. Growth in renewable technologies in the United States, particularly in wind and solar, has been driven by federal and state policies and declining costs.