Nuclear Energy
1. Overview
Nuclear energy in some sense captured the hopes and fears of a generation. The terrifying spectacle of nuclear fire as utilized in bombs inspired fear in millions and resulted in an episode of long and dangerous military posturing lasting nearly half of a century. Additionally, extensive atmospheric nuclear bomb testing released large amounts of radioactivity into the biosphere – the adverse health effects of which remain difficult to trace. At the same time, the harnessing of the energy potential of the atom through contained nuclear reactions was viewed as an exciting and revolutionary source of plentiful energy for the future. To many, nuclear seemed the obvious fuel of the future.
Image taken from the Saturday Evening Post, May 1956
The first reactor to produce electricity was a graphite reactor at the Oak Ridge National Laboratory, in Tennessee in 1949. In 1954, in Obninsk in the Soviet Union, a reactor was for the first time connected to a power grid. But it wasn‘t until the 1970s that energy generation from nuclear reactors became a mainstay of the energy mix. In this decade some 100 GW of installed generation capacity came online, driven primarily by utility companies in North America and West & Central Europe. Today, reactors planet-wide represent 422 GW of installed electrical generation capacity.
Despite wide deployment, nuclear energy remains a controversial source of energy as the industry has been rocked by cataclysmic accidents even as recently as 2011. And yet, it extends the possibility of producing vast amounts of power with zero direct green-house gas emissions. Over the past 50 years, the use of nuclear power has reduced carbon dioxide (CO2) emissions by over 60 gigatonnes – nearly two years’ worth of global energy-related emissions. Open questions remain about the future of nuclear as it relates to safety but also to the economics of a nuclear power strategy, as well as the management of associated nuclear waste, which requires planning into the distant future.
2. Reactor Design: The Generation Principle
Nuclear reactors serve three general purposes: The generation of electricity by way of heat exchange, the production of nuclear weapons material, and research; including physics experimentation and the production of radio-isotopes for medical research.
The key components of a nuclear power station with the nuclear core at its center are the nuclear fuel - or fissile material - the moderator, coolant and control rods. These components are brought together in a mechanical system which sustains and contains a nuclear reaction thereby enabling the harnessing of the energy of the atom.
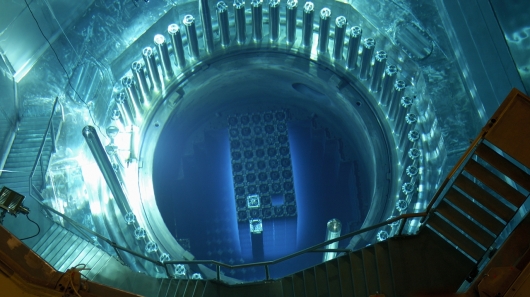
Nuclear fuel is typically uranium 235 enriched up to 4-5%. To produce power from enriched uranium, the fuel is made into pellets which are stacked into rods and subsequently aligned in close proximity. Depending on reactor efficiency, a single pellet can provide as much mechanical energy as 2,400 lbs of coal. A chain fission reaction is induced by firing neutrons at the uranium atoms. As the uranium splits into lighter atoms it releases radiation (energy) and additional neutrons. In order to allow for the chain fission reaction to be sustained a moderator surrounds the uranium rods slowing the movement of neutrons ensuring sustained collisions. In order to harness the energy produced from the reaction, a coolant - or heat transfer fluid - surrounds the core and transfers the heat away from the core in order to turn turbines. These turbines power generators, thus converting mechanical energy into electricity.
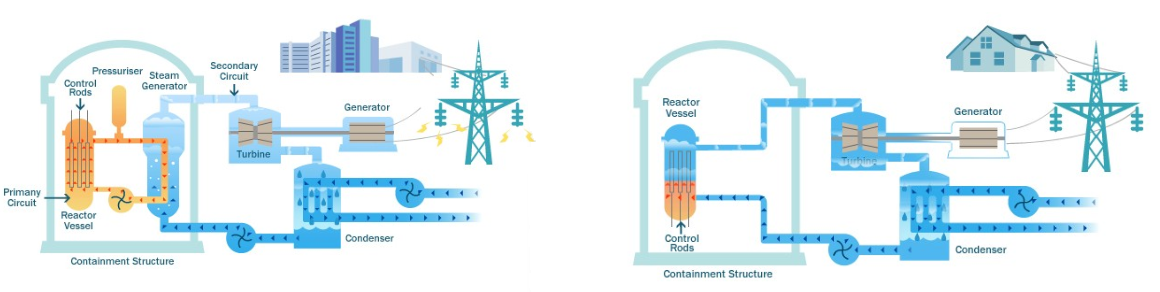
The most widely used coolant is water but reactors can and do utilize heavy water, gas, sodium and liquid metals. The heat transfer function serves to transfer energy from the core to do mechanical work but also keeps the reactor from melting. Control rods are present to slow or increase the rate of the nuclear reaction, as they can be lowered and raised into the reaction chamber. These control rods absorb neutrons and are commonly composed of cadmium, hafnium or boron. The most common reactors are pressurized water reactors (PWRs) and boiling water reactors (BWRs), with their generic schematics above. A global inventory count by reactor type indicates that 73 BWRs and 295 PWRs are in operation as of 2017.
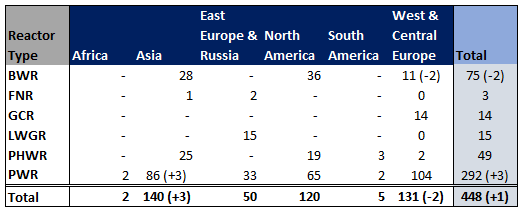
The less prevalent pressurized heavy water reactors (PHWR), while having some safety advantages, carry proliferation concerns given the low neutron absorbing properties of the moderator. PHWRs take the form of the CANDU reactors in Canada. In the heavy water setting, U238 when exposed to neutron radiation, can capture a neutron becoming U239. The atomic properties of the newly created U239 means that it rapidly decays into plutonium – a nuclear weapons material. The 15 light water graphite reactors (LWGR) are used exclusively in the former Soviet Union and production of plutonium was a factor in the employment of the reactors. These reactors are also known as RBMK - a variant of which was the malfunctioning reactor triggering the Chernobyl disaster. RBMKs in the FSU are all scheduled to be decomissioned between 2020 - 2030.
3. Nuclear by the Numbers
As of 2018, there are some 450 reactors dispersed throughout the globe, producing about 10% of the planet's electricity. In advanced economies, which maintain 74% of the world’s reactor capacity, this generation share is 18%.
Since 1990 electricity generation from nuclear plants has been largely stable in North American and Western & Central Europe. Much of the growth in the last three decades has occured in Asia.
Given the long lives of nuclear plants, it follows that the age of the nuclear generation capacity installed in the 1970s influences the average today. However the influence is disproportionate. The muted growth in new reactor construction in advanced economies in the past three decades means that the average US reactor is nearly 40 years old. In Europe and Japan the situation is similar. The only country with a nuclear generation capacity above 40 GW aged less than 10 years on average is China.
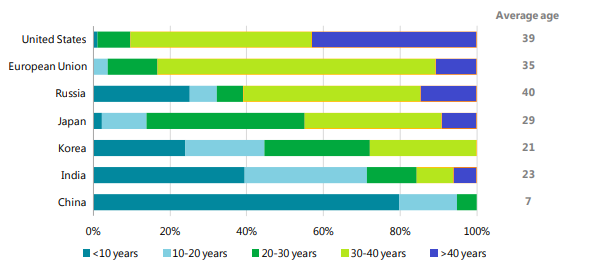
The global leader in nuclear production as a percentage of energy generation is France, with nearly 80% of its energy being derived from nuclear reactors. Including France, only 6 countries produce 40% or more of their electricity from nuclear. Outside of Ukraine and Armenia, the majority of nuclear representation in the electricity mix of Non-OECD economies is below 5%. While China has roughly 11% of the world's reactors, the fleet is responsible for only about 5% of its total electricty needs.
Despite legacy generation in advanced economies having remained stable, nuclear’s share in the global electricity generation mix has eroded as developing economies have not deployed nuclear on a proportional scale. This fact has negatively impacted carbon mitigation efforts. Indeed, the decline in nuclear power’s share in the electricity generation mix has entirely offset the growth in the share of renewables since the late 1990s. For those that argue that nuclear power is a central feature of a carbon free energy future, this is a material setback.
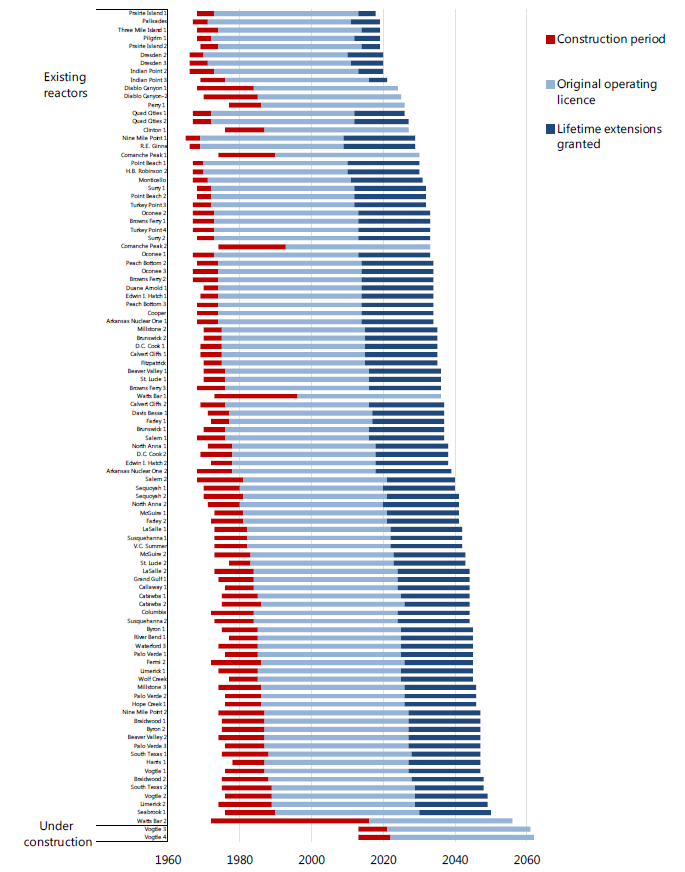
The challenge is compounded by the fact that many older reactors in the advanced economies are scheduled for decomissioning. An assessment of decomissioning schedules as well as construction plans suggests that the share of nuclear in the overall energy mix is set to decline. In the US, despite 20 year lifetime extensions already granted to the majority of US reactors, the US nuclear fleet is on course contract by 60% out to 2040.
To simulate the path the nuclear fleet may follow the Internationial Energy Agency (IEA) has defined a nuclear fade scenario. The basic assumption of the nuclear fade is that no new nuclear power capacity is built beyond those projects already under construction and that no further lifetime extensions are granted to existing reactors. The IEA estimates that to meet the emissions targets consistent with the ‘new policies scenario’ (a scenario in which carbon emissions are in excess of 35 gigatonnes) while allowing for the nuclear fade, would put significant demand on other sources of supply. The situation becomes even more challenging when trying to achieve the carbon emissions of the ‘sustainable development scenario’.
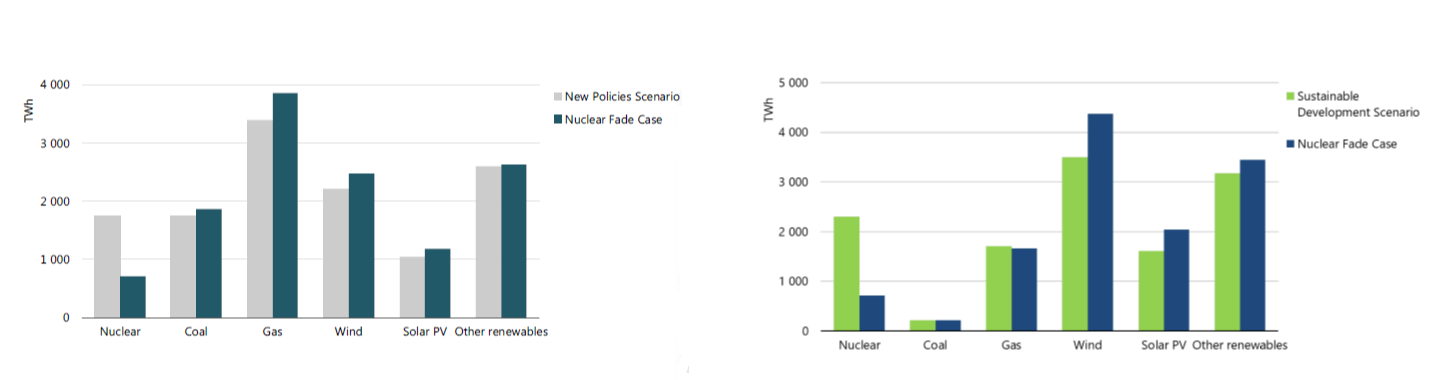
While it is in principle possible to achieve NPS or SDS without nuclear, leaving the low carbon energy potential out of the mix makes the target achievement more difficult as less low carbon energy generation options are available – in particular options for base load power. In the New Policies Scenario, global capacity rises by about one-quarter, with strong growth in China, India and Russia – with China becoming the leading nuclear power producer in 2030, overtaking the United States. The charts show a simulation of Nuclear Fade against the New Policy Scenario.
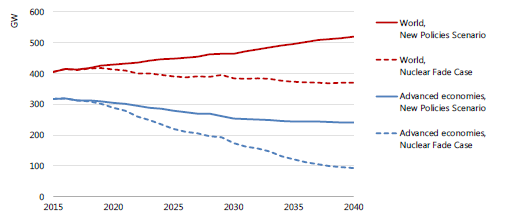
While 59 GW are scheduled to come online in the coming years the effects of the retirement of the fleets in advanced economies under nuclear fade would contract global nuclear capacity below 400 GW. Set against electricity demand growth the percentage of production this 400 GW represents would also continue to decline.
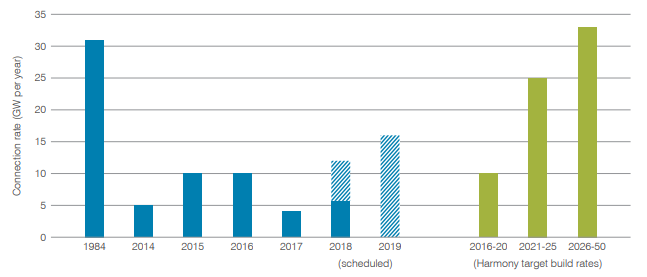
While the IEA NPS calls for 500 GW in capacity out to 2040, the scenario advocated by the World Nuclear Association (WNA) calls for the construction of 1,000 GW in cpaicty by 2050 - the so called ‘Harmony goal’. Such a plan would result in nuclear energy constituting 25% of expected electricity needs. A proposed average build rate suggested by the WNA is the construction of 10 GW annually out to 2020, 25 GW between 2021 and 2025, and 33 GW between 2026 to 2050. Essentially matching the building pace of the 1980s in second quarter of the century.
4. Safety: Worst Case Scenario Modeling
The low carbon benefits of nuclear power cannot be viewed in isolation. Nuclear power has an overwhelming safety imperative. A requirement whose failure to be met can lead to environmental calamity and potentially cripple the viability of nuclear power generation in the eyes of the public.
The constant cooling requirement of reactors makes them vulnerable to core meltdown and susbequent containment breach which can cause catastrophic release of radioactive materials into the biosphere. If the contents of the reactor core breach containment, they can spread rendering land in the proximity uninhabitable for decades and spread cancer and genetic mutation causing radioactive materials far beyond the site of the incident. The consequent economic destruction associated with such an incident is enormous.
Clearly, when something goes wrong, the incident can escalate to the point that costs incurred far exceed the revenues associated with half a century of electricity production. In such a situation even a remote probability of failure dramatically swings the cost-benefit relationship of building a nuclear plant towards a prohibitvely high cost conclusion.
Three nuclear accidents which - either partially or fully - have met with the worst case scenarios described above and have dramatically impacted the development of the space are those occuring at Three Mile Island in the United States (1979), Chernobyl in Ukraine (1986), and Fukushima Daiichi in Japan (2011).
The first incident at Three Mile Island (TMI) was comparatively mild with its primary consequence being the altering of public opinion towards nuclear plant safety. A sort of ending of the honeymoon phase with the technology was realized as the incident made clear to the public that these reactors could fail and the consequences could be dior. The seeming loss of control by those in positions of authority fruther inspired a loss of confidence. It seemed the technology could scarcely - if at all - be controlled in the event of failure and many reasoned such a risk was not worthwile.
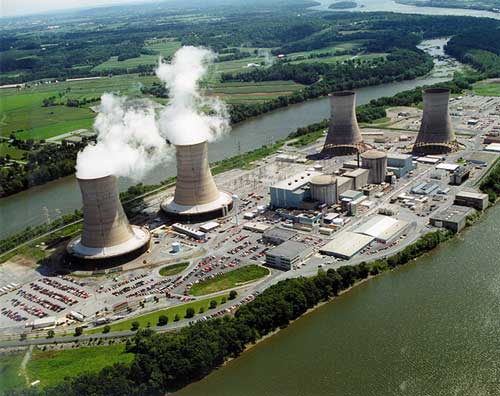
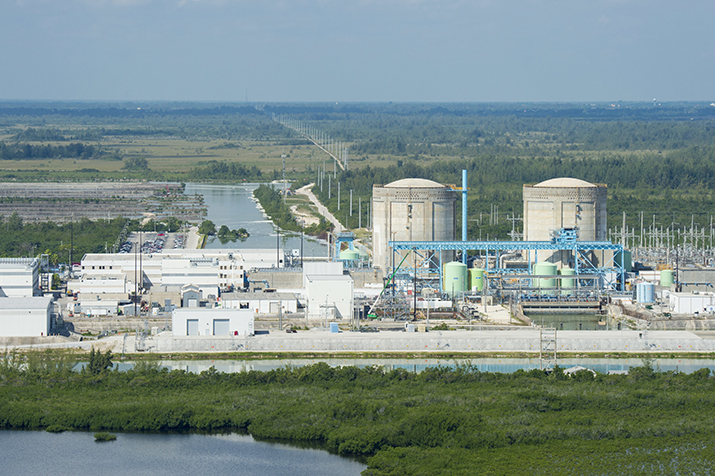
Indeed, it was't until some 5 odd years after the event that the full scale of the incident was clear. Once the interior of the containment unit could be inspected it was revealed that half of the core had melted - the result of core exposure which lasted for over two hours. Cleanup of the reactor in Unit 2 took over one decade and cost nearly $1 billion. As indicated by the inoperative condensing towers in the image above, Unit 2 ceased operations following the incident while Unit 1 remains operational to the present day. In April 2019, Exelon - the utility responsible for Unit 1 - stated it would cost $1.2 billion over nearly 60 years to completely decommission Unit 1 which is scheduled to begin in September 2019. The facility itself will be given decades to cool down, until it is safe to dismantle the structures. Exelon estimates that the plan to dismantle large components won’t begin until 2074.
While Three Mile Island had no directly linked casualties, the incident at Chernobyl resulted in an estimated 4,000 fatalities. It is to date the single worst nuclear reactor incident to occur. The positive void (or reactivity) coefficient in the reactor - a feature unlicensable in the United States - in addition to other design flaws meant that rather than the core melting and thereby breaching containment, there a was a real risk of the reactor itself blowing apart in a critical state. This is what happend on that fateful day on the 26th of April 1986 as the reactor core itself blew apart with the force of TNT. The explosure set the plant on fire and threw large pieces of the reactor core far distances. The resulting smoke plume contaminated parts of Europe and Belarus, far beyond even the borders of Ukraine itself.
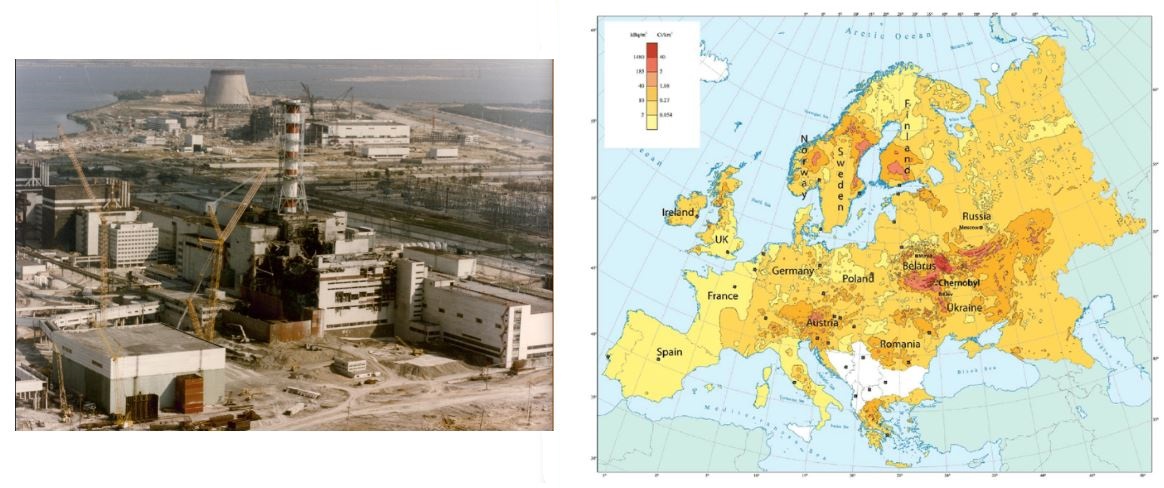
The disaster at the Chernobyl nuclear power plant in 1986 is estimated to have released 80 petabecquerel of radioactive caesium, strontium, plutonium and other radioactive isotopes into the atmosphere, polluting 200,000 square km of land. To this day, a 20km zone around the plant is no longer habitable for human beings. The clean up at the site of the incident drew on the efforts of 500,000 people with the heroics of some liquidators attempting to contain the situation. The end result being an encasement required to hold for. New sarcophagus - the arch - funded by Europe cost $1.8 billion.
In Fukushima, Japan, 3 reactor cores housed in units 1, 2 and 4 of the Fukushima Daiichi nuclear power plant experienced meltdown and the subsequent nitrogen explosion tore the roofs off of containment buildings. Additionally, the loss of coolant to the spent fuel pools in unit.
The response to the nuclear accident amounted to valiant efforts by firefighters risking their lives to get firehoses into the exploded containment buildings in a bid to cool the exposed reactors. Rather than an exhibition of controlled safety protocol, the incident looked more like a desperate and panicked scramble to avoid disaster. In the eyes of many it was again clear that a nuclear incident had gone well beyond the control of those responsible. And this time in an advanced economy with half of a century of experience with the reactor technology.
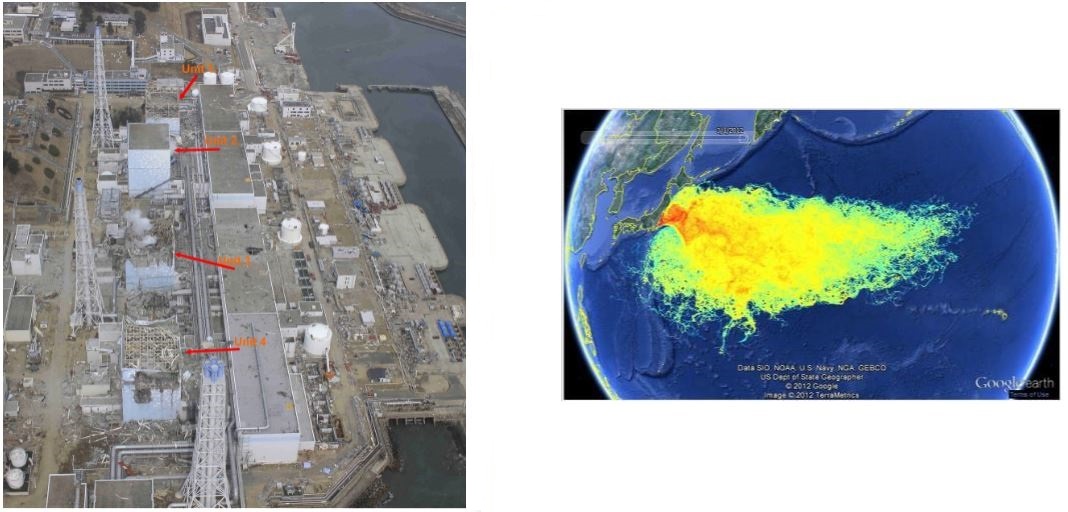
By some combination of luck and valiant effort, the Fukushima disaster was brought under control but not before 20 km of land in every direction from the reactor site had to be evacuated, a nuclear forest had been created and x radioactive materials escaped into the biosphere - on to top soil, the Pacific ocean and the atmosphere. During the accident, recordings from the surrounding water recorded caesium levels in excess of 50,000,000 times the normal level. Even today, 8 years later, containment of the situation is incredibly tenuous with the melted reactors needing to be continuosly cooled in what amounts to an open system. This open system means that contaminated water must be put into tanks after exposure with the reactor cores and spent fuel pools with an unknown portion escaping into the Pacific ocean. Some 1,000 tanks have been constructed on the site to store 100 million gallons of radioactive water with 100,000 gallons of newly contaminated water requiring storage each day. The result is a new containment tank with a capacity of 250,000 gallons being built every other day. To date, the disaster has caused $180 billion in damage – a figure which is an x multiple of the original cost of the reactor facility.
While Japan opted to power down its reactor fleet in the wake of the disaster, 32 Fukushima era reactors (BWR 1960 vintage) and 15 RBMK reactors remain operational, with all 15 RBMKs actively generating electricity. The RBMKs have however been modified to augment the control rods and bring down the reactivity coefficient (a central culprit in the accident) though it still remains positive.
Regulation
The US Nuclear Regulatory Comission (NRC) is responsible for the commissioning of nuclear plants in the United States and conducts worst case scenario modelling for proposed and existing plant designs. As well as assessing the probability of such events occuring, it simulates their outcomes where they to occur. The NRC established its regulatory requirements for reactors, materials, and waste applications to ensure that "no undue risk to public health and safety" results from licensed uses of facilities and materials covered by the Atomic Energy Act. The NRC's requirements aim to ensure that there is a low enough probability of accidents that could adversely affect the health and safety of the public.
Such a framework as that used by the NRC is known as a probabilistic risk assessment (PRA). PRA evaluates nuclear plant safety by examining a broad spectrum of initiating events. PRA analysts then assign probabilities to such events which are dependent on plant design. Analysts then explore the frequency and consequences of various scenarios, providing a measure of risk.
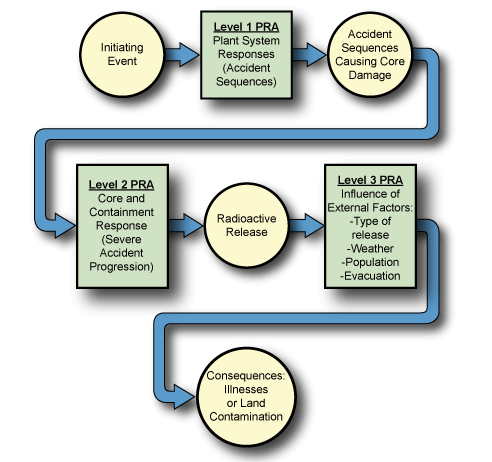
Despite the various ways an issue can arise, the central problem which all reactors are vulnerable to is loss of coolant. The overheating nuclear reactors can become uncontrolled and a full-scale meltdown can be realized. The NRC breaks such an accident sequence (or sequences) into level 1 (likelihood of initiating event), level 2 (radiological breach of containment) and level 3 (ecological consequences of the breach). It is required that a plant achieve a low enough probability or series of probabilities for these events occuring in order for an operating license to be awarded.
5. Nuclear Economics: The Future of Nuclear
As previously mentioned, installed nuclear power has permitted the offsetting of large amounts of carbon dioxide. However, most of the nuclear reactors in operation today in advanced economies were built before the year 1990. The chart below plots reactor construction starts and share of nuclear as a percentage of total electricity. The downward trend in production share and the contraction of construction starts calls into question the economics of building nuclear reactors. The shocking events at TMI, Chernobyl and Fukushima are all evident in the numbers.
Relative to the past the nuclear space is stangnating.
A lurking cost - to which insufficient attention was paid 1960s and 1970s boom years - is the challenge of nuclear waste storage. With the exception of a waster storage facility in Olkiluoto, Finland, there is as yet no long term storage location for high-level radioactive waste. Indeed, for all practical purposes, it can be said that the price of nuclear power is eternal vigilance – and long term planning.
Present and Future Generation Reactors
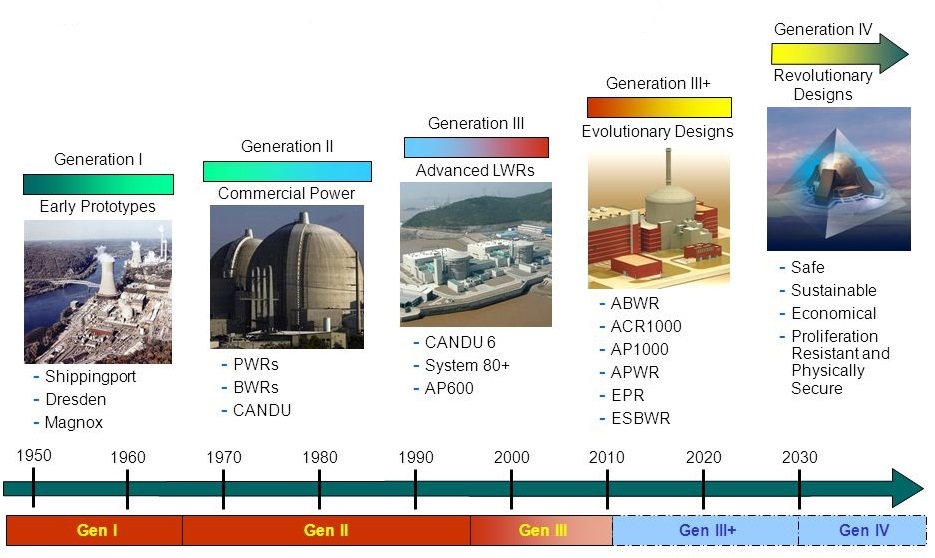
A generational schema has been fitted to the development of the nuclear space by the U.S. Department of Energy splitting the categorization up by Generations numbered one through four. Early experimental reactors constitute Gen I reactors and prototypical reactors of Gen II deployed at commercial scale include the PWR, CANDU, BWR, AGR and RBMK. Improvments on the intitial commercial scale prototypes comprise Gen III, with Gen III+ representing the present state of newly constructed reactors. Gen IV refers to those theoretical designs currently undergoing testing.
The economics and safety features of Gen III+ reactors will have much to say about how nuclear figures in the global energy generation mix over the next 2-3 decades. Offsetting the nuclear fade scenario as introduced by the IEA will depend more on the successful and scale deployment of Gen III+ reactors than extending the life of existing legacy reactors.
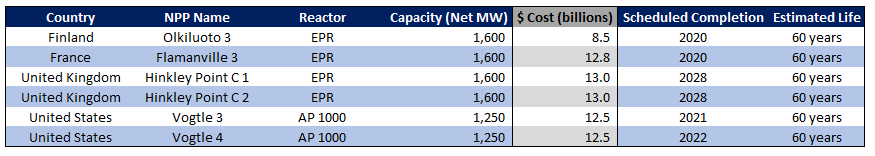
The interim generation reactors represent an "evolutionary design" based on improvments of Gen III reactors, principally PWR and BWR technology. Phase III+ reactors based on PWR technoloy with realized deployment or in-process construction are the EPR (European Pressurized Reactors), AP 1000 (Advanced Passive) reactors, developed respectively by the French Electricite de France (EDF) and U.S. based Westinghouse Electric.
These reactors, while based on Gen II and III PWR technology incorporate increased effiency and safety features, including passive nuclear safety systems as well as simplified designs resulting in less pipeing and wiring and thereby by less risk of an adverse incident occuring. Additionally, they are designed for 60 years of operation versus 40 for most existing nuclear power plants.
Despite the advantages of these interim reactors, the enormous capital outlays accompanying deployment have put considerable strain on the initiative. The producers of the reactors - initially Areva for the EPR and Westinghouse Electric Company - both went into insolvency in association with their push into the Gen III+ space. This underscores the fact that the renaissance in the nuclear industry which these reactors represent have and continue to face existential threats.
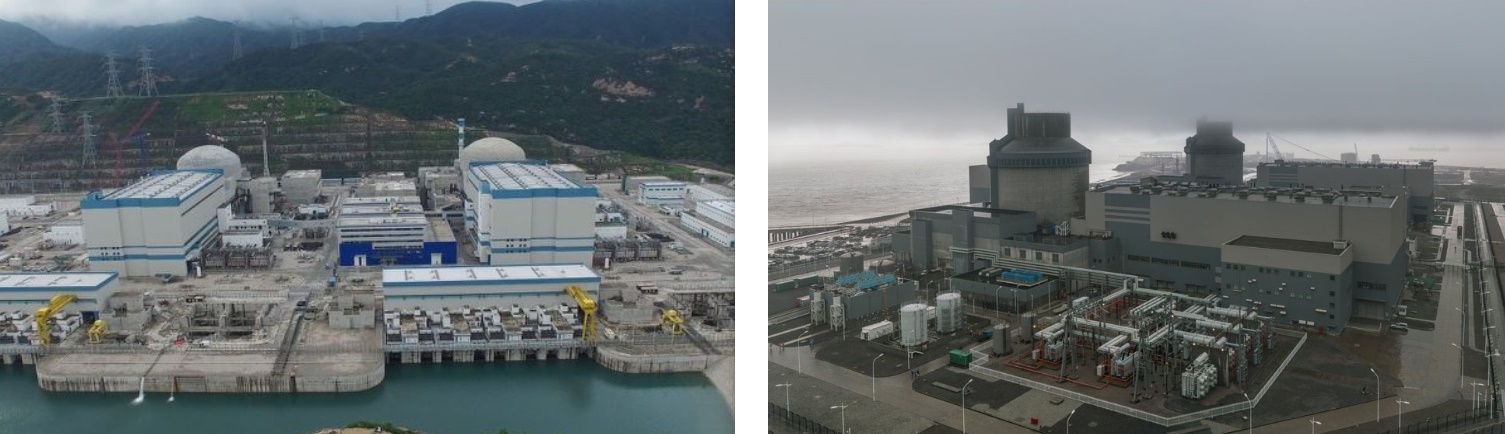
The installation of these reactors have been met with success in China with two APR 1000s going online in Sanmen in 2018 and an EPR going online in Taishan in the same year with the second to achieve grid connection in 2019. As such, China is the first country to host Gen III+ reactors.
Attempts to realize this same success in Europe and the United States have been more turbulent. This turbulence is unwelcome news to nuclear deployment in advanced economies. For context, the installation of the two planned AP 1000s in the US and the four EPRs in Europe would mark the first newly constructed reactors in a generation.
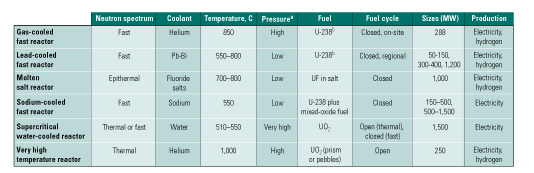
In contrast to the "evolutionary designs" of the Gen III+ reactors, Gen IV reactors represent "revolutionary designs", as they propose substantial change to reactor and system design. Next generation reactors that don't melt down and have modular designs. Reactor designs from NuScale. Applications to biofuel and hydrogen production using process heat. Gen 4 international forum. A geographical view on where these reactors are currently under development has been provided by Third Way based on survey data.
Another feature of many of Gen IV reactors is their ability to produce hydrogen as a by-product. Realizing this potential could make the use of fuel cells for transportation and power generation more economic and environmentally benign while reducing dependence on imported oil. Sufficient quantities of hydrogen for commercial use would be produced during off-peak periods, improving the operating economics of nuclear baseload plants. A long-term objective would require dedicated Gen IV nuclear plants, operating at higher temperatures, to produce hydrogen at a steady rate for storage and subsequent use by large (>1,000-MW) banks of fuel cells to address daily peak demand.