Oil
1. Overview
First drilled for in 1859, oil – or petroleum – plays a primary role in modern economic activity. The scale and scope of its use in transportation is enormous as automotive, maritime and air transport all depend almost entirely on petrochemical fuels. Additionally, oil is widely deployed in the chemical products space counting among its end products that all important material — plastic. Oil also enjoys applications in road construction, lubrication and space heating. To modern man oil is a pervasive product and faced with a dramatic shortage of the so-called "black gold" our economic machine would virtually come to a halt.
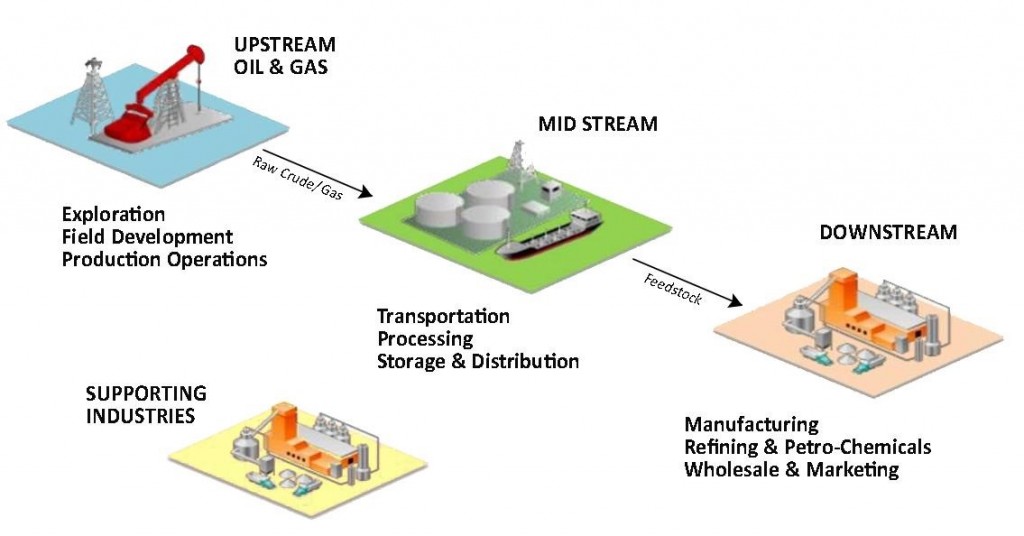
The process by which oil is sourced and made avaible for use is referred to as the oil supply chain which can be broken up into three parts: 1) upstream, 2) midstream and 3) downstream. The upstream portion of the market is associated with production of the crude oil which is obtained through drilling into geological deposits or reservoirs to pump out the crude oil product. Oil is additionally obtained through the processing of sand granules (or tar sands) containing trace deposits of crude. Much non-sands oil production is jointly produced with natural gas which is referred to as associated gas. Conversely, low density oil which is produced from a predominantly natural gas well is referred to as natural gas liquids (NGLs) or condensate. Upon separation from gases and impurities, the oil is moved through pipelines, rail car, tanker, or some combination of the three, to refineries – this transport segment being the so-called midstream portion of the oil supply chain. Once the oil is delivered to refineries it is chemically manipulated to yield usable products. A commonly used measure of oil is one barrel which represents 42 US gallons of crude. A typical breakout of the products associated with inputting one barrel of oil would be gasoline (44%), diesel & heating oil (24%) and jet fuel (4%), with the remaining 22% going to assorted products including petrochemicals, lubricants and asphalt. This end stage of the supply chain is referred to as the downstream segment.
Crude oil is characterized by its API gravity or viscosity and its sulfur content. With gravity ranging from heavy to light and sulfur content rendering the crude sour (high content) to sweet (lower content). The constitution of the crude oil will have implications for the types of refineries in which it can be processed and each refinery in a given run is geared towards a particular output mix.
2. Market Dynamics
As with most markets, prices are determined by a complex web of interactions between the supply and demand sides of the market. In the case of oil, the market is global with more or less uniform pricing across sub-markets. The demand side is highly correlated with economic activity which drives demand for oil products. On the supply side, large scale project investments are made on a continual basis with price and demand expectations foremost in the minds of producers.
2.1 Supply
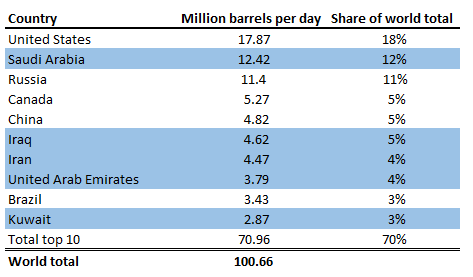
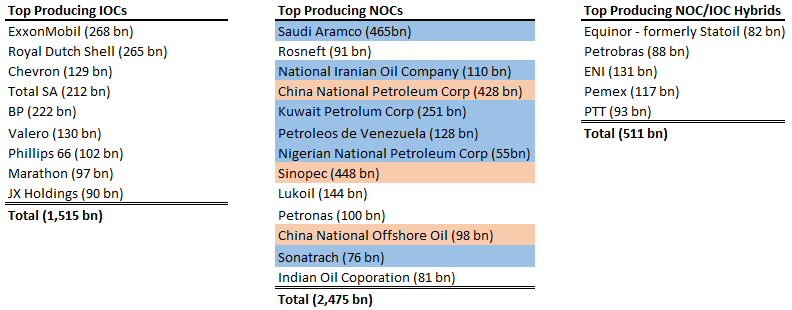
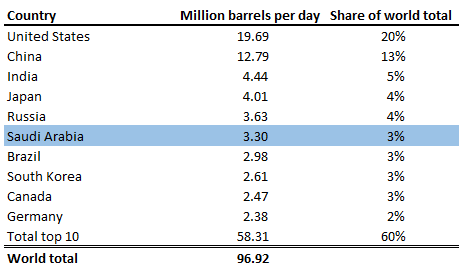
While year-over-year production may change from country to country reflecting investment and production decisions the composition of the top 10 is relatively stable. With the top 3 producing countries representing over 40% of global production. Supply from the top 3 provides an interesting picture in that it encapsulates several distinct supply models. That is private oil companies, state-controlled oil companies and state controlled oil companies with cartel (or OPEC) membership. Private oil is generally grouped under the umbrella term International Oil Company or IOC; whose operations are dictated by market forces. State owned oil companies are grouped under the term National Oil Company or NOC and their production and investment decisions may deviate from market considerations in the interest of national objectives, be they strategic or otherwise. Special cases of NOCs exist in the form of NOCs which co-operate in the cartel known as OPEC or the Organization of Petroleum Exporting Countries (highlighted in blue below). As such, the drivers of supply of this commodity react to a variety of forces which extend beyond conventional market forces introducing an additional layer of complexity.
National production is generally correlated with national proven reserves. Total proved oil reserves are taken to be those quantities that geological and engineering information indicates with resonable certainty can be recovered in the future from known reservoirs under exisitng economic and operationg conditions.
Proved Oil Reserves, 2015 (Units = bn bbl)
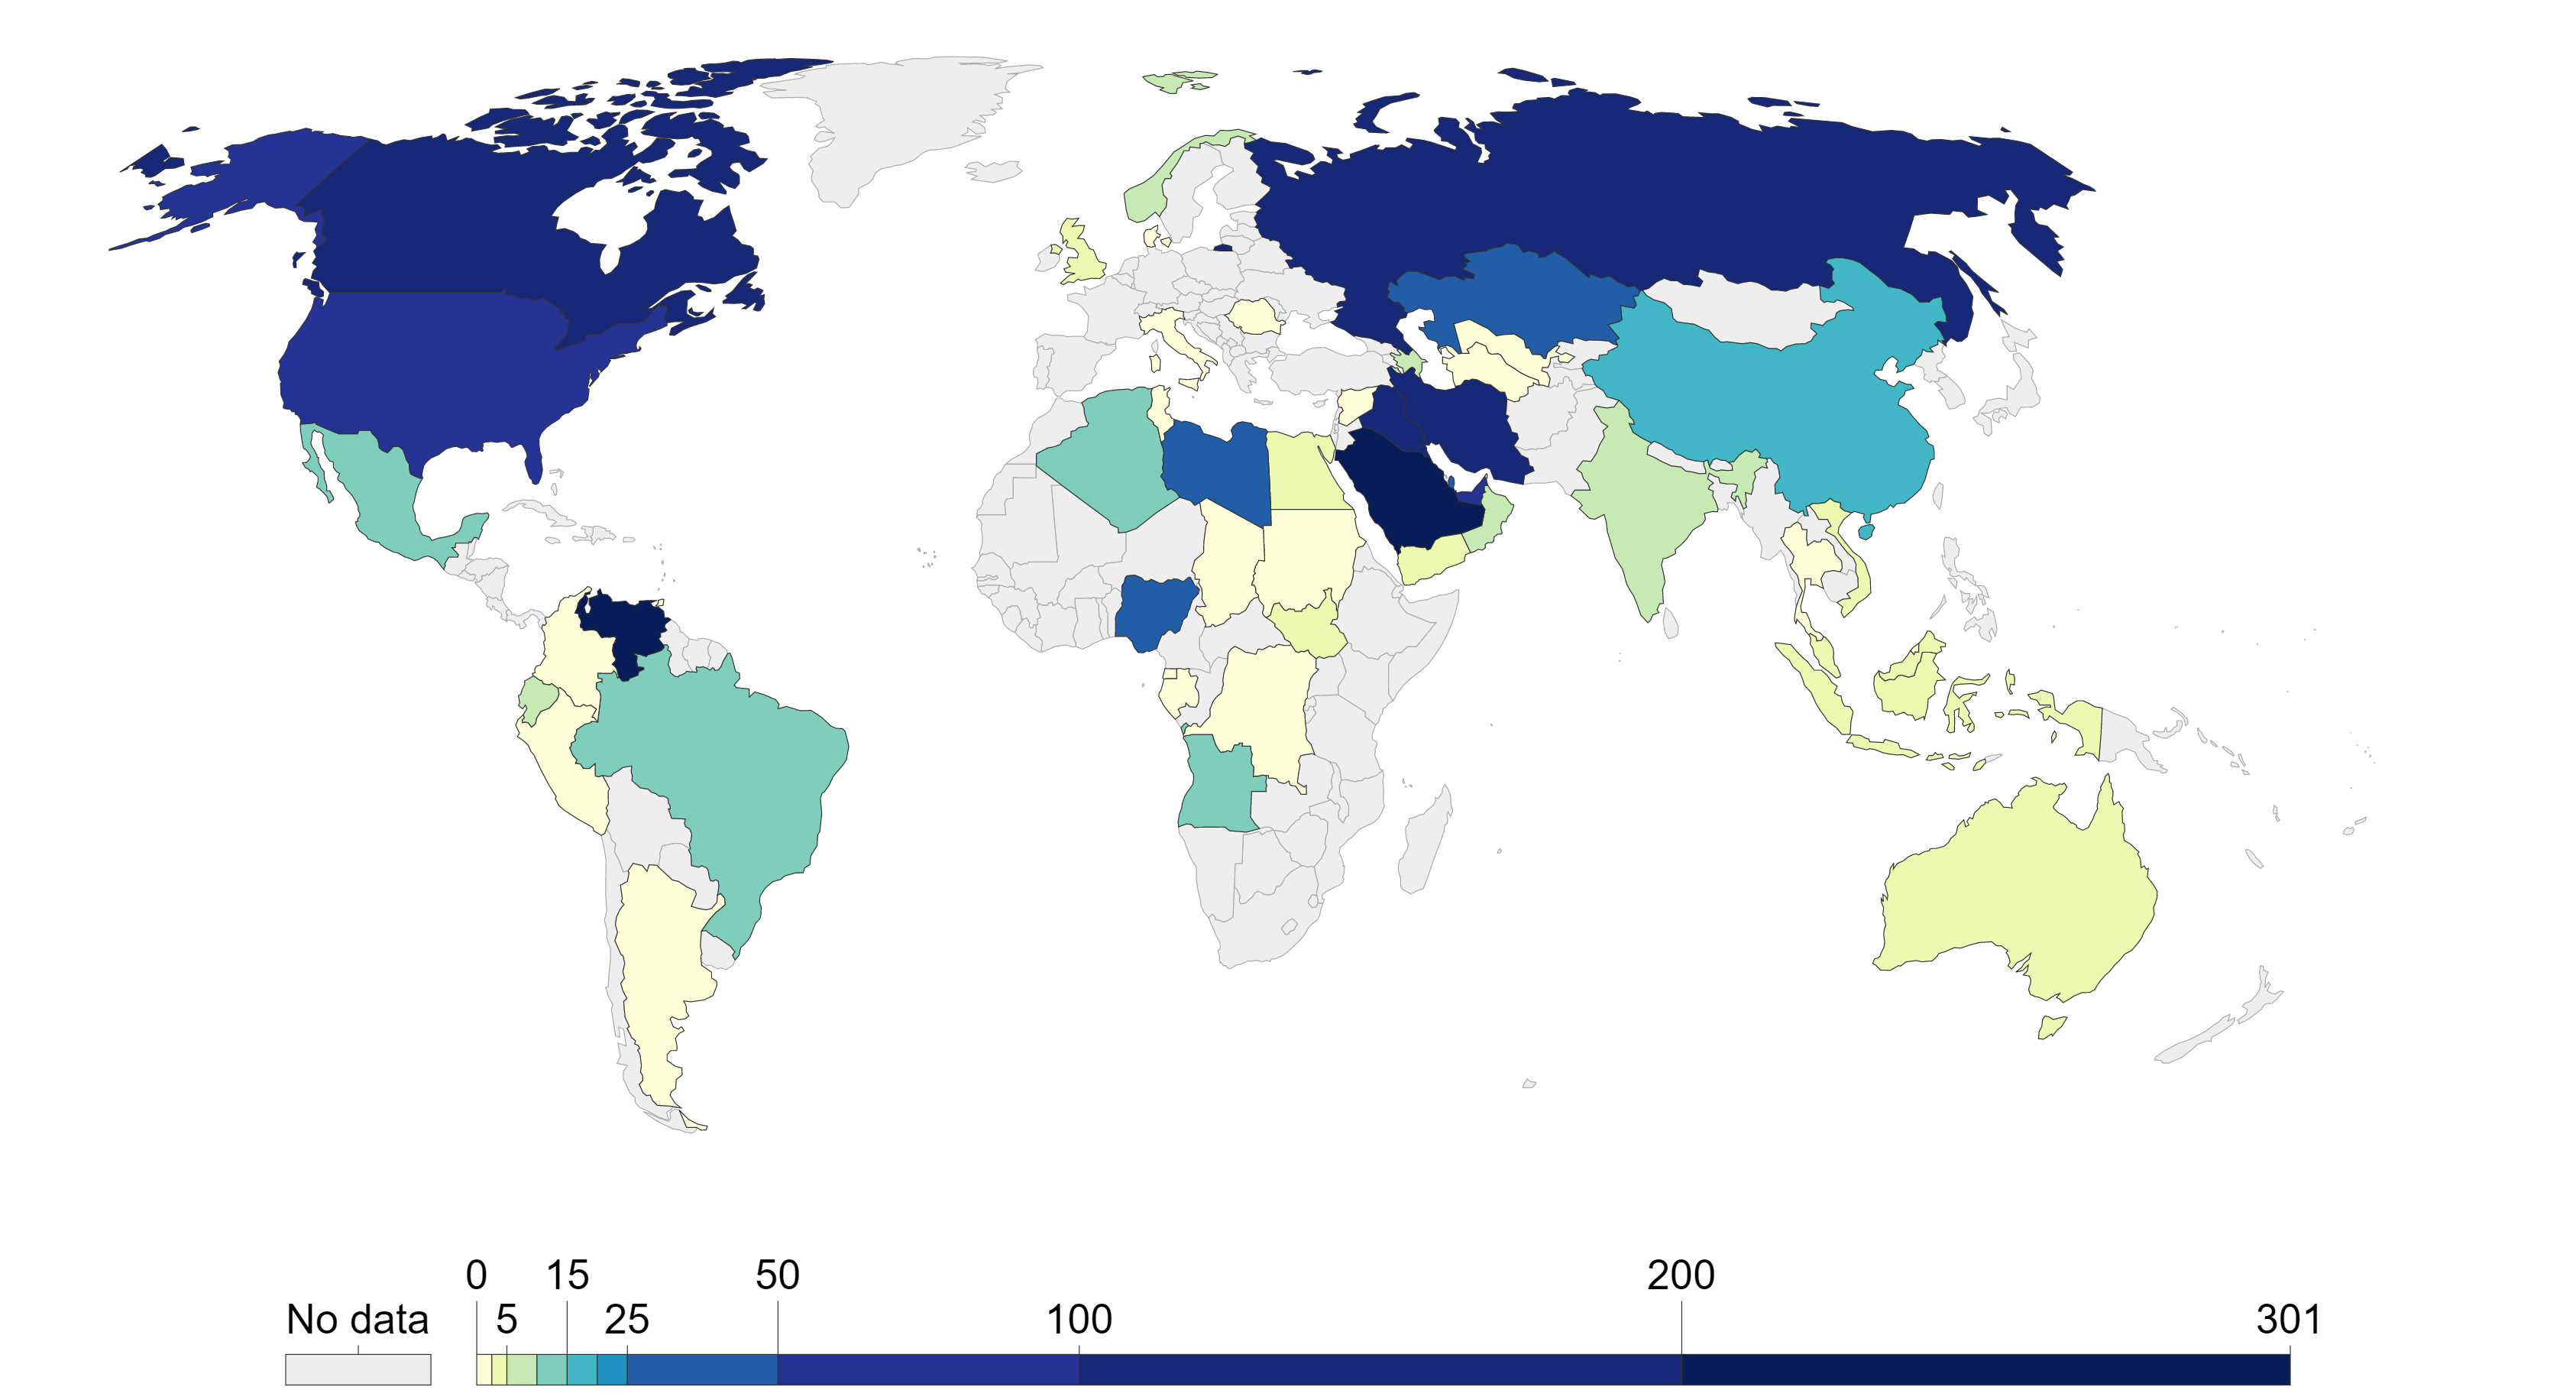
The largest producers by revenue in 2017 are outlined below. Deviating somewhat from the prior IOC, NOC, NOC-OPEC classification introduced earlier, the NOC group can be extended to introduce a 'hybrid' form which describes a state owned oil company that largely operates on its own accord rendering the NOC designation more nominal than describing a company which de-facto operates under the control of the state. What the reserve and NOC-IOC picture make clear is that the oil market is dominated by state controlled actors (OPEC in blue, China in red).
Production in the last 30 or so years has tracked development as increased economic activity tends to result in increased transportation and petrochemical consumption. To meet this demand sources of supply have moved from large on-land reservoirs to the drilling of wells deep below the seabed and in prohibitively harsh environments. Production by source implies a cost curve with harder to reach oil supplies naturally requiring a higher price point in order to move forward with production/investment.
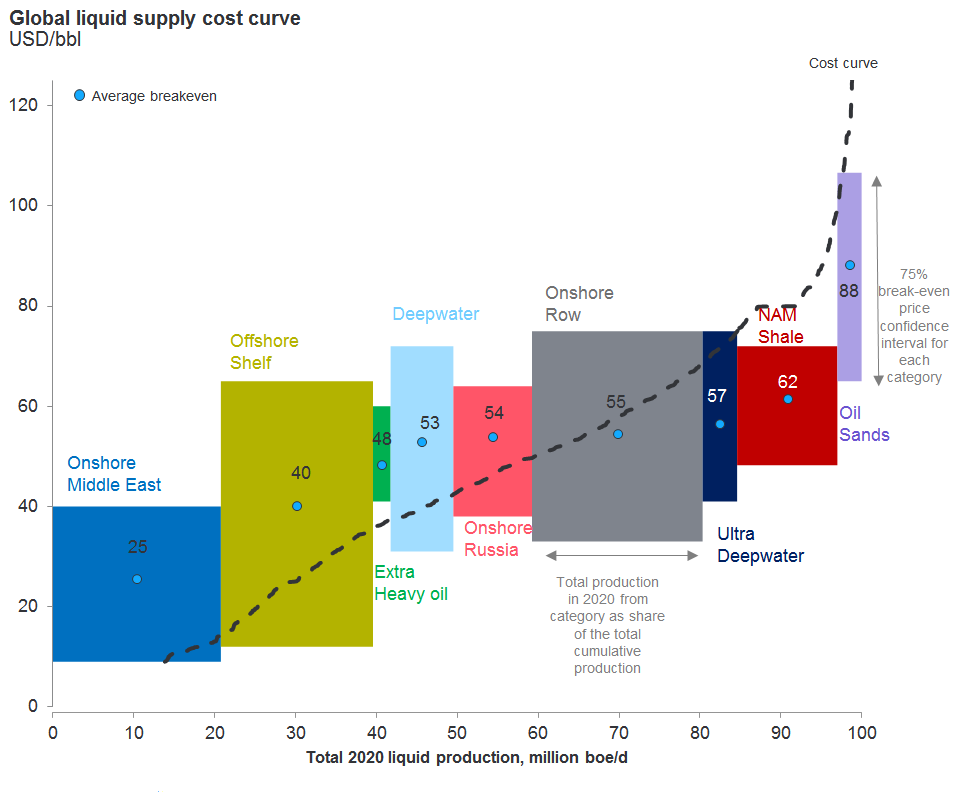
The supply curve on its own is not static but variable. An oil cost curve provides information on how much extra supply could be forthcoming at a given price of oil. As such, a flattenting of the curve represent additional supply being available at a given price level or marginal increase in price - in short, production response to price. Technological developments may hence flatten supply curves as has been the case in the last few years in the light-tight oil (LTO)/ shale space.
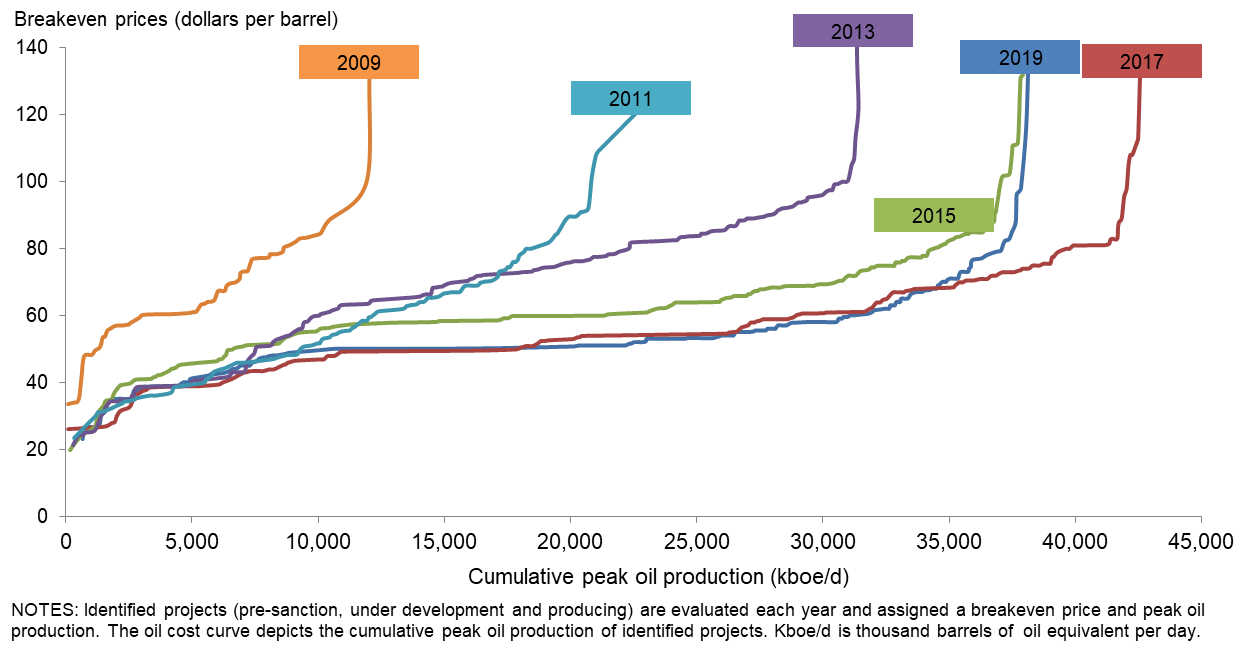
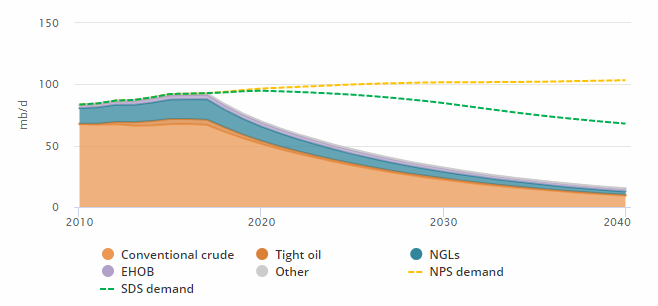
An additional supply-side dynamic is the decline rate of existing wells. As oil is a depletable resource and as such constant investment is required to (i) maintain current production levels and (ii) produce beyond current levels to meet demand. The IEA projects that a cessation of new invesment could result in production contraction by roughly 50% by 2025. As such, new project investment is a central component of the supply and demand picture.
2.2 Demand
As discussed, the demand for crude oil can be traced to its economic uses as end products. The world presently consumes approximately 100 million barrels on a daily basis (mm bp/d). This is a phenomenal amount and the breakdown of consumption by country is linked to the composition, volumes and efficiency of the tranport fleets. Given the relatively inelastic demand from both the transport fuel and feedstock spaces, a steady supply of oil often regarded as a national security priority.
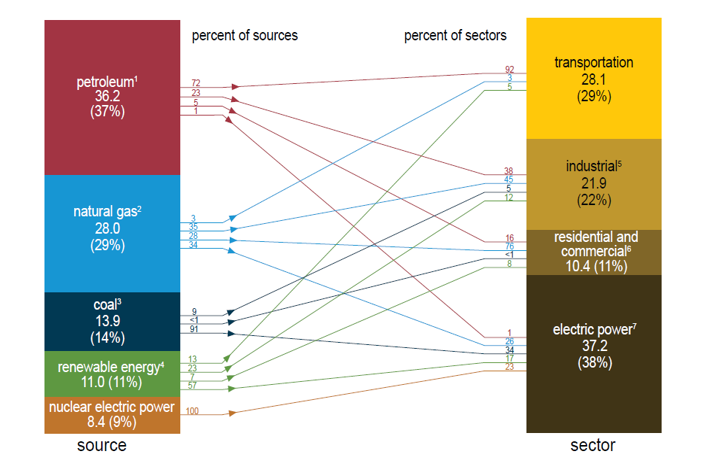
The below diagram shows how 92% of oil consumption is used in powering the US transport fleet. Which such a disproportionate dependence on oil it is clear vital the product is. Indeed, the Strategic Petroleum Reserve or SPR was established for the purpose of mainting transportation viability in the event of a significant supply shortage.
Oil and other Fuels by End Use (United States - 2017)
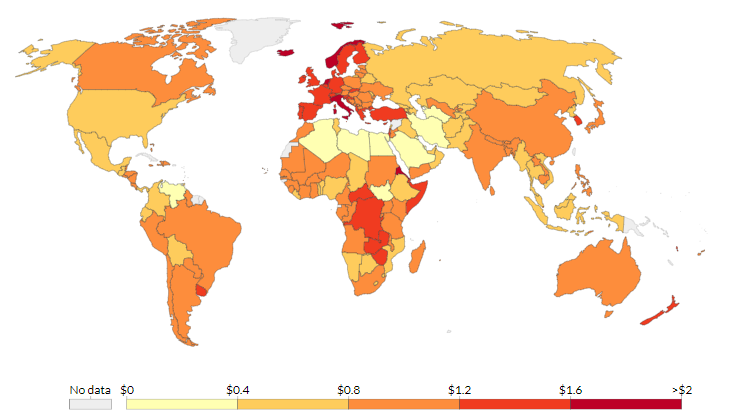
The tax and subsidy environment in various countries impacts the prices consumers pay at the pump. In some instances the taxes reflect a national priority to move away from gasoline powered transport and in the case of subsidization, a political tool to appease the populace and stimulate economic activity by artificially depressing prices.
Pump prices for gasoline (US$ per liter), 2016
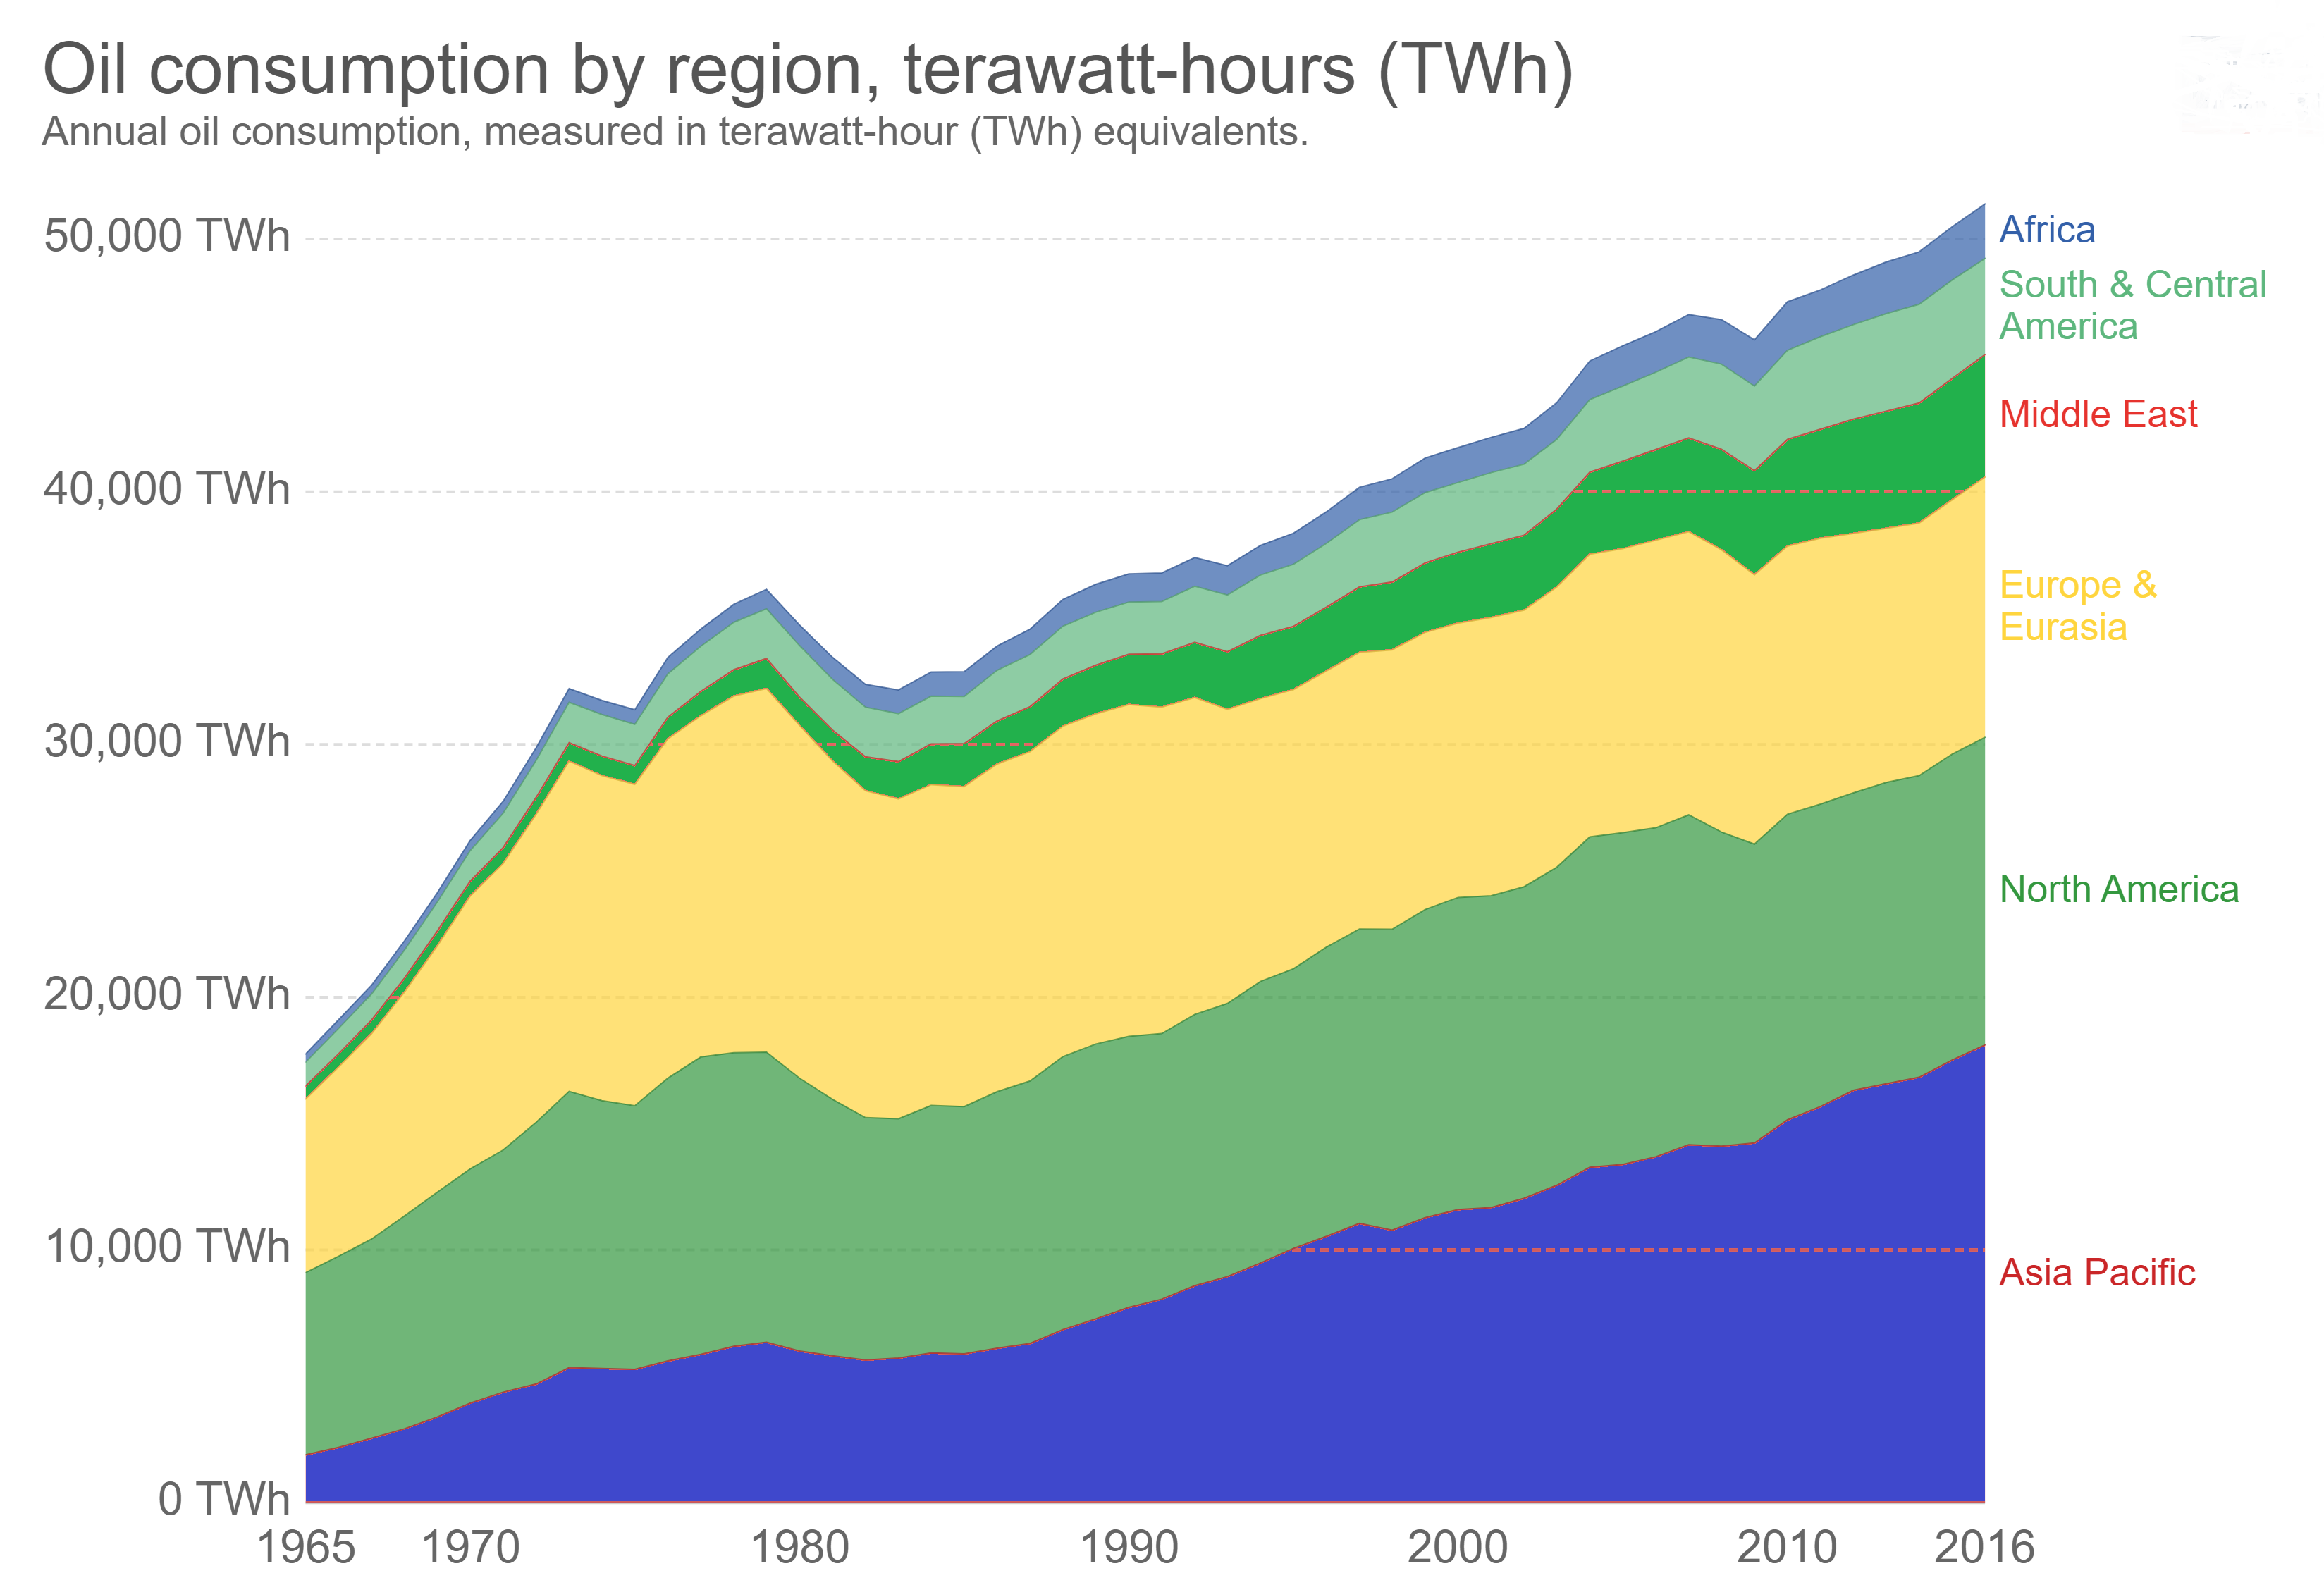
The US market, given its high vehicle penetration rate, leads the world in both absolute and per-capita consumption figures. However, growth rates in Asia, in particular in China and India, have in the past decades come to exert massive demand for oil products despite on average paying more for certain end products such as gasoline and diesel.
Indeed, the consumption picture has been altered by growth in the Asia-Pacific region as OECD and FSU regional demand has remained largely constant since the 1980s.
2.3 Price
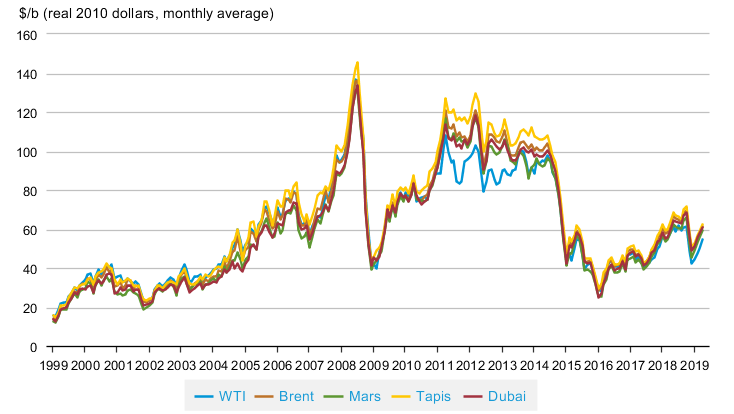
Crude oil trades for immediate delivery in the so-called spot market while the product also entertains a lively futures/forward market. The benchmark prices for the crude reflect prices established in major hubs, including:
(i) Brent; Light-sweet crude with its hub in the North Sea
(ii) WTI; Light-sweet crude reflecting trading in the Texas/Oklahoma area
(iii) Dubai; Medium-sour crude in the Gulf region
(iv) Mars; Medium-sour crude benchmark in the Americas
(v) Tapis; Light-sweet crude benchmark in Asia
The benchmarks can trade at a positive or negative spread to one another reflecting regional supply and demand dynamics in the respective local markets. An example of this is the WTI-Brent spread which reflects over-supply stemming from the LTO space. The rates of production essentially force transactions closer to the point of production rather than getting the crude out to other markets with prices nearer the other benchmarks. While these spreads to crop up in the market they are always in some sense bounded by the possibility for arbitrage in the global market.
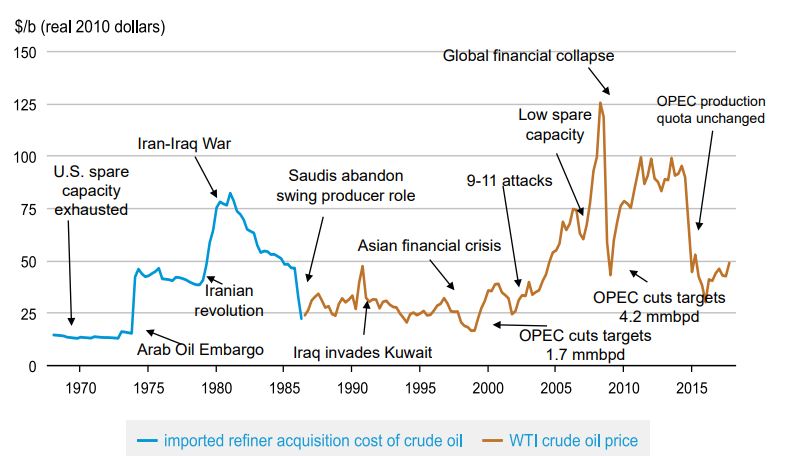
The global market for crude has an additional side effect which is the sensitivity of price to disruptions — wherever they may occur on the planet. Such events have historically included unilateral actions taken by producers to cut production, terrorist attacks, military conflict, political turmoil etc.
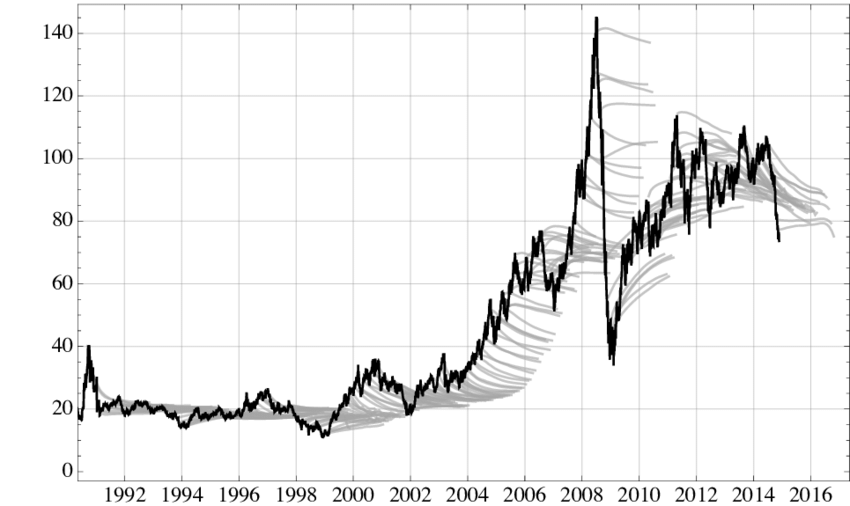
Additionally, oil is a commodity to which derivative financial products are indexed. There is ongoing discussion as to whether or not the derivative markets distort the pricing mechanism by exposing the price to influences beyond fundamentals or supply and demand. The conversation remains controversial as it is difficult to disprove that the products are being used without economic or funamental justification. The classic example is the forward/futures market for crude oil. Producers hedge their production by selling oil forward, e.g. determining in advance the prices at which the product will be sold. And consumers lock in prices for oil through buying it forward. The objective on both sides of the transaction is to reduce risk and plan for the future. Generally, when the futures price is below the spot price the market is said to be in backwardation whereas in the converse situation the market is said to be in contango.
3. Statistical Analysis & Forecasts
Projecting a given variable of the oil market requires the application of statistical techniques combined (ideally) with contextual understanding of the market.
3.1 Sample Period Selection
The starting point of a statistical model is sample selection. The objective is to train a model over a time series demonstrating sufficient variability such that the spectrum of events are captured in any forecast. Additionally, when working with observation economic data, the sample should reflect the historical episode most likely the characterize the future.
3.2 Series Properties: Trends, etc
3.3 Auto/Partial Correlation Tests
3.4 ARIMA Models: Single-Variable Models
Economically-atheoretic univariate models.
3.5 VAR/VECM Models: Multi-Variable Models
This paper builds on the ARIMA models to introduce a system of dynamically interrelated variables in order to improve on forecast performance. For this purpose a vector autogression and vector error correction model are introduced and tested.
3.6.1 Download: Data
Download Economic Data: Download
Download Production Data: Download
3.6.2 Download: Models
Download Python Code: Download
Download Excel Interface: Download